Forecast.Solar
The restful API for solar production forecast data and weather forecast data
Powered by PVGIS and various weather services
Features
Solar production
(All plans)
The always weather based solar production forecast, historic averages and clear sky optimum provides watt powers and kilo watt energy data.Weather
(Professional account upwards)
The weather forecast provide sky coverage amount, textual weather condition and icon URL, temperature and some wind information.Time windows
(Professional account upwards)
If you have controllable loads, you can use this route to determine time windows in which switching processes can be automated based on the forecast.Chart
(Professional account upwards)
Draw a daily solar production forecast chart with simple Javascript snippets.Solar production, weather and time windows data are provided for up to 7 days with a resolution of 1 hour down to 15 minutes.
If you then checked the documentation and you like it, register an account for more features.
Calculation model
For the forecast, these 2 data points are mainly used in each case:
- historic irradiation data from PVGIS per plane combined with -
- weather forecast data per location from several weather services -
From the actual weather forecast for the location (with a possible offset because there are not so many stations around), we use e.g. the cloud coverage factor and the temperature forecasts, the cloud coverage is the most important, the temperature is relevant in hot summers when the modules can have > 70 °C which lowers the performance.
Data coverage
The figure shows the areas covered by the Photovoltaic Geographical Information System (PVGIS) solar radiation databases and therefor by Forecast.Solar. With the latest update PVGIS 5.2 almost the entire world is now covered!

(Click to enlarge)
Restful API
The API can deliver responses in JSON, CSV or XML
The Swagger compatible API definition is available in YAML.
Example: Get solar production estimate
You can easy build and test the required URLs with the Swagger-UI.
Request
https://api.forecast.solar/_your_API_key_/estimate/54.9/25.3/37/0/1
Response (professional account, 15 minutes resolution)
{
    "result": {
        "watts": {
            "2019-06-22 05:15:00": 17,
            "2019-06-22 05:30:00": 22,
            "2019-06-22 05:45:00": 27,
            ...
            "2019-06-29 20:15:00": 14,
            "2019-06-29 20:30:00": 11,
            "2019-06-29 20:45:00": 7
        },
        "watt_hours": {
            "2019-06-22 05:15:00": 0,
            "2019-06-22 05:30:00": 6,
            "2019-06-22 05:45:00": 12,
            ...
            "2019-06-29 20:15:00": 2545,
            "2019-06-29 20:30:00": 2548,
            "2019-06-29 20:45:00": 2550
        },
        "watt_hours_day": {
            "2019-06-22": 2626,
            "2019-06-23": 2918,
            "2019-06-24": 2526,
            "2019-06-25": 2866,
            "2019-06-26": 2892,
            "2019-06-27": 1900,
            "2019-06-28": 2199,
            "2019-06-29": 2550
        }
    },
    "message": {
        "type": "success",
        "code": 0,
        "text": ""
    }
}
Charts
You can direct draw chart for solar production estimate using the Forecast.Solar widget.
(Professional account upwards)
Chart for the geographical midpoint of Germany at 51°9'N,10°27'E with a declination of 37°, looking south with 10 kilo watt peak installated.
Today
/chart/0/1442fd2d.js
Without given title or subtitle, no title is printed and the subtitle defaults to dateTomorrow
/chart/1/1442fd2d.js?title=Forecast+for+{date}
Title with date placeholder, no subtitle is printedIt is also possible to show charts of the historic average data and the theoretic data for clear sky conditions.
Todays historic average production
/chart/history/1442fd2d.js?title=Historic+data
Title without date placeholder, subtitle defaults in this case to the dateTodays theoretical clear sky production
/chart/clearsky/1442fd2d.js?subtitle={place}
No title given but subtitle with placeholderPlease refer to the documentation for details and check also the example page.
The Script URL was build with: https://api.forecast.solar/demo-key/chart/51.15/10.45/37/0/10
Registration
You should consider to register an account, for features and rate limits compare plans in detail.
With the paid subscription models, all the functions listed below can be explored for 14 days without risk.
If you don't want to use your paid subscription after the exploration period, you can cancel the subscription any time during the exploration period and no costs will be charged.
With a subscription you will have a Self-Service area to see some information about your account and find/reset your API key if needed. (Login is the PayPal subscription Id and your PayPal email address)
After you have subscribed, you will automatically receive 2 emails to the primary email address that is stored at PayPal:
- from PayPal with among other things your subscription Id
- from Forecast.Solar with your API key and further information
If you do not receive the email from Forecast.Solar promptly, do NOT try to make another subscription, check your SPAM folder! You can also go direct to the Self-Service to find your API key.
Please note:
-
Please double check if your location and plane parameters
definitions are correct!
You should always do this with the given check routes for locations and planes! - Always test with the public API before make a subscription!
- If it looks like the PayPal registration page is hanging, please check whether an AdBlocker is active.
Account models
Public
Free for life
This works without API key for free, no subscription needed.
(You will not receive an API key for a donation.)
- Solar production forecast data
- Forecast horizon: This and the next day
- Data resolution: 1 hour
Best for users without loggers to get a quick idea about coming solar production.
Personal
16 EUR/yearSubscription with a valid email required, access with API key, free trial of 14 days.
Provide the same features as the Public API plus:
- Adjust forecast
- Average historic solar production data
- Forecast horizon: This and the next 3 days
- Data resolution: 30 minutes
Best for users with loggers to integrate the data automatic.
 Subscribe (16 EUR/year)
Personal Plus
28 EUR/yearSubscription with a valid email required, access with API key, free trial of 14 days.
Provide the same features as the Personal API with more detailed data:
-
Request up to 2 planes in one request
(This is for example helpful for east/west installations) - Forecast horizon: This and the next 3 days
- Data resolution: 15 minutes
Best for users with loggers to integrate more detailed data automatic.
Subscribe (28 EUR/year)
Professional
70 EUR/yearSubscription with a valid email required, access with API key, free trial of 14 days.
Provide the same features as the Personal Plus API plus:
- Request up to 3 planes in one request
- Time windows for controllable loads
- Weather forecast data
- Solar production forecast chart
- Theoretical solar production data under clear sky conditions
- A SPA (e.g. for mobile phones) with charts for the expectations for today and tomorrow
- Forecast horizon: This and the next 6 days
Best for business users with more than one plant and/or loggers to integrate the data automatic.
Subscribe (70 EUR/year)
Professional Plus
120 EUR/yearSubscription with a valid email required, access with API key, free trial of 14 days.
Provide the same features as the Professional API plus:
- Request up to 4 planes in one request
- Double rate limits
Subscribe (120 EUR/year)
Enterprise
Pay-per-Use
On request
Please refer to the Enterprise Pay-per-Use plans and make sure to check which implementation model you have or are planning to implement before making an enquiry.
Please get in touch so that we can get an impression of your requirements.
APP developers
It is not allowed to share the API key with e.g. clients of your product! (It will also not work because of the rate limits for the API key.)
-
If you are developing an APP that will be delivered to customers in any way, the following setup is suggested:
- Deliver the APP with the use of the Public API by default.
- Provide an APP setting/configuration option where an API key can be entered.
- Your customers can now decide whether they want to take out a subscription themselves if they are interested in having more data. (This is for example the way, how the Home Assistant integration works.)
- If you host your APP yourself and the API key is not visible to your customers, please check out the Enterprise Pay-per-Use plans description above.
There are also some notes for developers in the documentation.
Integrations
![]()
Home assistant is an open source home automation that puts local control and privacy first.
The integration was introduced in Home Assistant 2021.7(Here instructions in German language)

Solectrus is an alternative photovoltaic dashboard that visualises the yield and consumption of a PV system.
Available on Github.

The Python Package Index (PyPI) is a repository of software for the Python programming language.
Asynchronous Python client for getting solar forecast information.KNX
KNX - the intelligent standard for building
The logic module Forecast Solar provides a forecast of the PV yield of a specific site (E5 & E6).

EisBaer is a multi-protocol gateway visualization for creating intelligent, efficient and safe buildings.
Less energy consumption for more sustainable buildings and therefore lower operating costs. (Handbook)
![]()
my4e is the unofficial app for E3/DC home power stations, exclusively for iOS and WatchOS
With my4E, you can view current and historical performance data from your E3/DC home power plant easily, quickly and in detail on your iPhone or iPad, create diagrams and export data.

IP-Symcon - SMARTHOME WITHOUT COMPROMISES
For homeowners, corporations, and integrators - Design your building completely by your imagination. A smart software for your hardware. (Module on Github)

Node-RED
is a programming tool for wiring together hardware devices,
APIs and online services in new and interesting ways.
Forecast.solar API call to analyse and display solar forecast in Home Assistant
Solar yield forecasting using forecast.solar
Cost-optimised control of a heat pump with dynamic electricity prices

Hubitat
- The Home Automation As It Was Meant To Be
Hubitat driver to retrieve a solar production estimate using the public API from forecast.solar
 Homey
Homey
Homey - The world's most advanced smart home platform.
Use the Solar Forecast App (Pro) to switch on electric appliances or charge a car or battery based on the forecast solar power, to maximize self-consumption.
![]()
openHAB empowering the smart home
The SolarForecast Binding provides data from Solar Forecast services. Use it to estimate your daily production, plan electric consumers like Electric Vehicle charging, heating or HVAC.
![]()
evcc - Solar charging. Super simple.
If you configure
forecast data,
the estimated remaining production for the current day will be shown in the UI.
You also get a forecast chart for the upcoming days.
Testimonials

Flexible tariffs and battery charging automation for winter
An automation can help maximise your savings. But there are many ways to make such an automation, and they all look complicated.
How to dynamically adjust the percentage of overnight charge so that it charges to 100% when low solar production is expected on the next day.

Forecast Solar in Home Assistant einrichten
Ich möchte dir zeigen, was du damit alles machen kannst und wie du es einrichtest.
Es ist nicht nur umweltfreundlich, sondern auch eine großartige Möglichkeit, deine Stromrechnung zu senken!

PV‑Vorhersage für Home Assistant: E‑Auto und smarte Geräte effizient laden
"Ich denke niemals an die Zukunft. Sie kommt früh genug", soll Albert Einstein gesagt haben. Und er lag natürlich falsch.
Denn wer über die Zukunft seiner PV‑Erträge nachdenkt, kann seine smarten Geräte besser steuern. So läuft die Waschmaschine erst, wenn genug Sonnenstrom vorhanden ist und das E-Auto pausiert das Laden, wenn die Prognose schlecht aussieht.
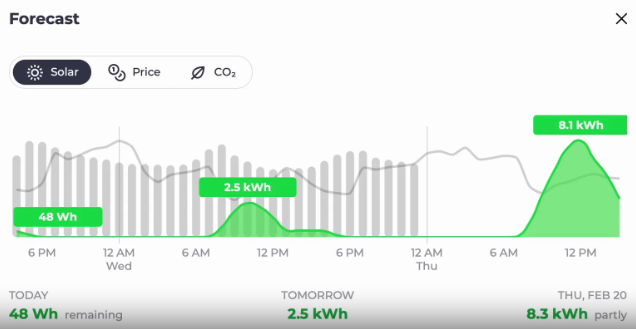
evcc Forecasts
Clicking on this number or the new Forecast menu item takes you to a new view that visualizes the expected PV production for the next 48 hours.
This visualization also shows price and CO₂ forecasts.
Support channels
A Helpdesk is available for support.
Forecast your Solar production
With the increasing share of photovoltaics in the electricity market, the importance of Solar energy forecasts. These are an important tool for the integration of Solar power into existing network structures.
The production of solar power is dependent on external influences on which man has no or only limited influence. For example, Season, time of day, weather (eg ambient temperature, sun/clouds, air turbidity).
A solar day covers the global energy supply for eight years.
Predictions about the availability of solar-generated electricity in the future support private power management, but are of great importance, above all, for commercial solar power generators and network operators.
Cancellation
- go directly to your PayPal Subscriptions and cancel the subscription or
- click the following button to create a corresponding ticket in our helpdesk